SAS Enterprise Guide
Enterprise Guide is the user-friendly way to develop SAS programs – that manipulate data and produce analytical reporting. Destiny Corporation Education provides introductory and advanced courses to develop user proficiency.

Easy-to use interface & wizards
- Intuitive wizards provide access to SAS capabilities from basic reporting to complex analyses.
- A log is generated with information about processing, including notes, warnings and errors.
- Results can be delivered in HTML, RTF, PDF, SAS reports and text formats. Most results also can be output as SAS data sets for further analysis with other tasks.
- Graphs can be created as ActiveX (dynamic or image), Java Applets (dynamic or image), GIFs or JPEGs.
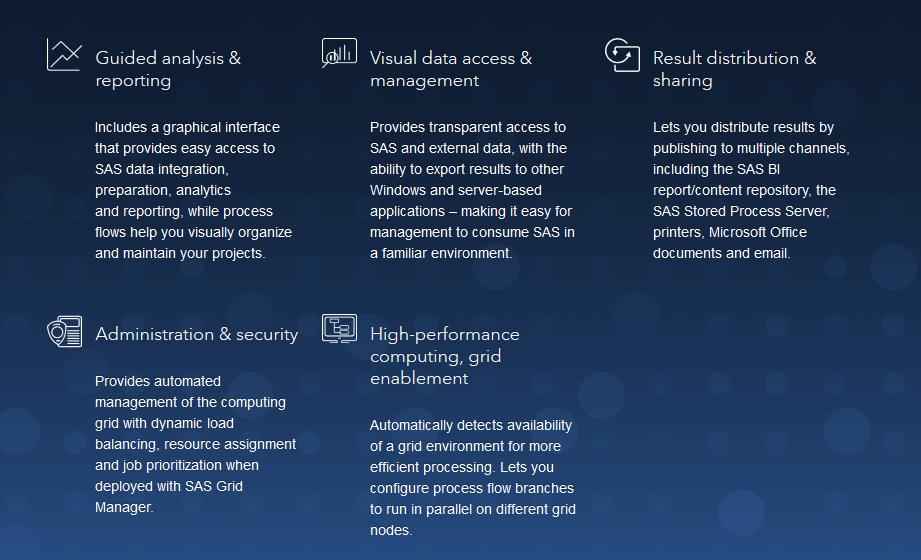
- An intuitive process flow diagram facility allows users to organize, view and maintain their projects visually.
- The Data Explorer Tool lets you create custom views of data, quickly calculate basic charts and statistics for each column in a SAS data set, and add a data exploration view to your project.
Reporting, graphical & analytical tasks
- Descriptive reports and analysis include basic listings, summary statistics tables, one-way frequencies tables, correlations tables and graphs, and tabular or graphical distribution analysis.
- Graphs include area charts, bar charts, box plots, bubble plots, donut charts, line plots, maps, pie charts, radar charts, scatter plots, surface plots and contour plots.
- Analysis of variance (ANOVA) predictive models: t-test, one-way ANOVA, nonparametric one-way ANOVA, linear models and mixed linear models.
- Regression models: linear, logistic, nonlinear and generalized linear models.
- Multivariate relationship models: cluster analysis, factor analysis, principal components, canonical correlation and discriminant function analysis.
Data management
- Visually access any data type supported by SAS and native Windows data types via ODBC, OLE DB, and OLE DB for OLAP Server (specifically SAS OLAP Server, Microsoft Analysis Services and SAP BW). Accessible local file types include Microsoft Word documents (embeddable in project files to help document your project work), Excel, HTML, Access, TXT files (fixed width), ASC files (ASCII), TAB delimited files and CSV files (comma delimited).
- Powerful, graphical query builder allows users to visually access and manipulate their data without SQL expertise: Join up to 256 tables simultaneously.
- Graphically or programmatically subset data to reduce the results to manageable sizes and to identify the data you require.
- Visually build calculated variables from a comprehensive list of SAS functions.
- Perform data subsets using a variety of basic and statistical methods.
- Includes automatic chart options for more meaningful analysis.

